 When it comes to a machine learning or data science related problem, the most difficult part would be finding out the best approach to cope up with the task. Simply to get the idea of where to start!
Cross-industry standard process for data mining, commonly known by its acronym CRISP-DM, is a data mining process model describes commonly used approaches that data mining experts use to tackle problems. This process can be easily adopted for developing machine learning based predictive models as well.

CRISP – DM
No matter what are the tools/IDEs/languages you use for the process. You can adopt your tools according to the requirement you’ve.
Let’s walk through each step of the CRISP-DM model to see how it can be adopted for building machine learning models.
Business Understanding –
This is the step you may need the technical knowhow as well as a little bit of knowledge about the problem domain. You should have a clear idea on what you going to build and what would be the functional value of the prediction you suppose to do through the model. You can use Decision Model & Notation (https://en.wikipedia.org/wiki/Decision_Model_and_Notation) to describe the business need of the predictive model. Sometimes, the business need you are having might be able to solve using simple statistics other than going for a machine learning model.
Identifying the data sources is a task you should do in this step. Should check whether the data sources are reliable, legal and ethical to use in your application.
Data Understanding –
I would suggest you to do the following steps to get to know your data better.
- Data Definition – A detailed description on each data field in the data source. The notations of the data points, the units that the data points have been measured would be the cases you should consider about.
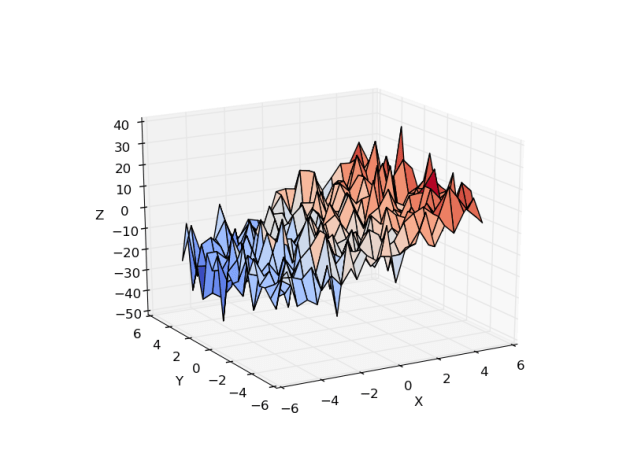
- Data Visualization – Hundreds or thousands of numerical data points may not give a clear idea for you what the data is about or an idea about the shape of your data. You may able to find interesting subsets of your data after visualizing it. It’s really easy to see the clustering patterns or the trending nature of the data in a visualized plot.
- Statistical analysis – Starting from the simple statistical calculations such as mean, median; you can calculate the correlation between each data field and it will help you to get a good idea about the data distribution. Feature engineering to increase the accuracy of the machine learning model. For performing that a descriptive statistical analysis would be a great asset.
For data understanding, The Interactive Data Exploration, Analysis and Reporting tool (IDEAR) can be used without getting the hassle of doing all the coding from the beginning. (Will discuss on IDEAR in a long run soon)
Data Preparation –
Data preparation would take roughly 80% of your time of the process implying it’s the most vital part in building predictive models.
This is the phase where you convert the raw data that you got from the data sources for the final datasets that you use for building the ML models. Most of the data you got from raw sources like IoT sensors or collectives are filled with outliers, contains missing values and disruptions. In the phase of data preparation, you should follow data preprocessing tasks to make those data fields usable in modeling.
Modeling –
Modeling is the part where algorithms comes to the scene. You can train and fit your data to a particular predictive model to perform the deserved prediction. You may need to check the math behind the algorithms sometimes to select the best algorithm that won’t overfit or underfit the model.
Different modeling methods may need data in different forms. So, you may need to revert back for the data preparation phase.
Evaluation –
Evaluation is a must before deploying a model. The objective of evaluating the model is to see whether the predictive model is meeting the business objectives that we’ve figured out in the beginning. The evaluation can be done with many parameter measures such as accuracy, AUC etc.
Evaluation may lead you to adjust the parameters of the model and might have to choose another algorithm that performs better. Don’t expect the machine learning model to be 100% accurate. If it is 100% most probably it would be an over fitted case.
Deployment –
Deployment of the machine learning model is the phase where the client, or the end user going to consume. In most of the cases, the predictive model would be a part of an intelligent application that acts as a service that gets a set of information and give a prediction as an output of that.
I would suggest you to deploy the module as a single component, so that it’s easy to scale as well as to maintain. APIs / Docker environments are some cool technologies that you can adopt for deploying machine learning models.
CRISP-DM won’t do all the magic of getting a perfect model as the output though it would definitely help you not to end up in a dead-end.
 If you are fond of playing with data to dig out the relationships of it and to plot interesting visualizations with data; python is the language you should speak.
 Access your notebook from “Notebooks” tab of AzureML Studio. When creating a new notebook, you can select which language and version you want to have in your notebook. Python 2, Python 3 and R are the supported languages right now.
 On the notebook menu bar, you can find out the ‘help’ menu which contains a brief user interface tour as well as a list of keyboard shortcuts that you can use to drive the notebook.