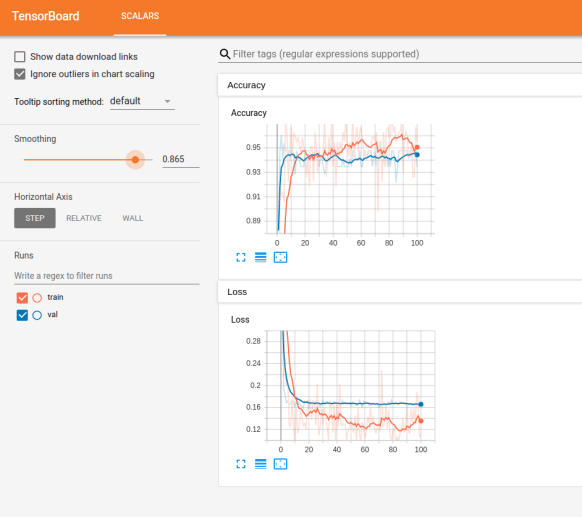
Tensorboard Interface
Training and evaluating deep learning models may take a lot of time. Sometimes it’s worth to monitor how good or bad the model is training in real-time. It’ll help to understand, debug and optimize your models without waiting till the model get trained to monitor the performance.The good old method of printing out training losses / accuracy for each epoch is a good idea, but it’s bit hard to evaluate the metrics comparatively with that.
A real-time graphical interface that can use to plot/ visualize metrics while a model is training through epochs or iterations would be the best option. Tensorboard is visualization tool came out with TensorFlow and I’m pretty sure almost all TF guys are using and getting the advantage from that cool tool.
So what about PyTorchians?? Don’t panic. Official PyTorch repository recently came up with Tensorboard utility on PyTorch 1.1.0 . Still the code is experimental and for me it was not working well for me.
Then, I found this awesome opensource project, tensorboardX. Pretty similar to what PyTorch official repo is having and easy to work with. TensorboardX supports scalar, image, figure, histogram, audio, text, graph, onnx_graph, embedding, pr_curve and video summaries.
5 simple steps…
- Install tensorboardX
- Import tensorboardX for your PyTorch code
- Create a SummaryWriter object
- Define SummaryWriter
- Use it!
I just did a simple demo on this by adding Tensorboard logs for the famous PyTorch transfer learning tutorial. Here’s the GiHub repo. Just clone and play around it.
Note that in the experiment I’ve used two SummaryWriter objects two create two scalar graphs for training phase and the other one for validation phase.
The log files will be created in the directory you specified when creating SummaryWriter object. (You can change this directory to wherever you want)
To view the tensorboard, open a terminal inside the experiment folder. Assume that your log files are inside ‘./logs/’ . Use the following command to spin up the tensorboard server on your local machine.
$ tensorboard –logdir ./logs/
Sometimes you may use a remote server or a VM (might be a Azure DLVM) for training your deep learning models. Then how to get this tensorboard out from there??
SSH Tunneling with post forwarding is a good option you can use for this. You just have to spin up the tensorboard service on your remote machine. Then tunnel the server back to your workstation with the ssh command stated below.
$ ssh -N -L 6007:127.0.0.1:6006 <username>@<remote_ip>
127.0.0.1:6006 : Tensorboard server running on the remote server / VM
6007 : local workstation port
You can then view the tensorboard running on the remote machine through your local machine’s browser.
http://<remote_ip>:6006
That’s it! Simple and neat. No need to wait couple of days till the model get trained. Just monitor and stop early if it’s not learning well.
Enjoy Deep Learning!
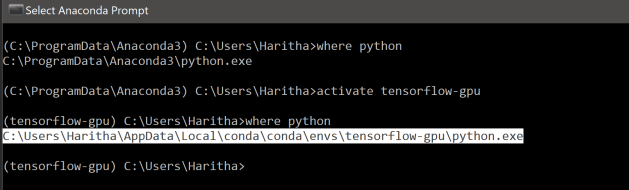
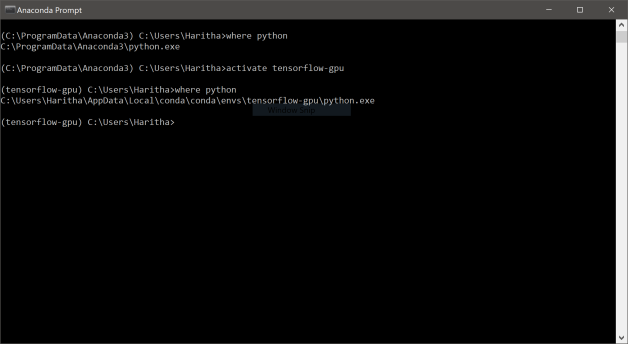
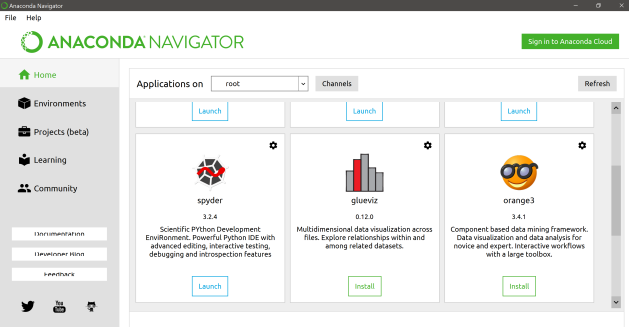
 For the safe side, use python virtual environments. It would avoid many hassles occurs with library dependencies. I’ve used anaconda environment as the base of virtual environment.
 Here the API operates through POST methods which accepts the input in JSON.
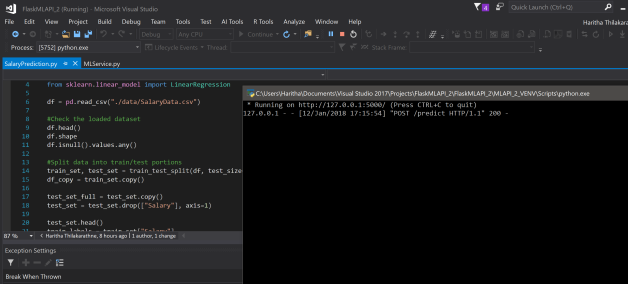

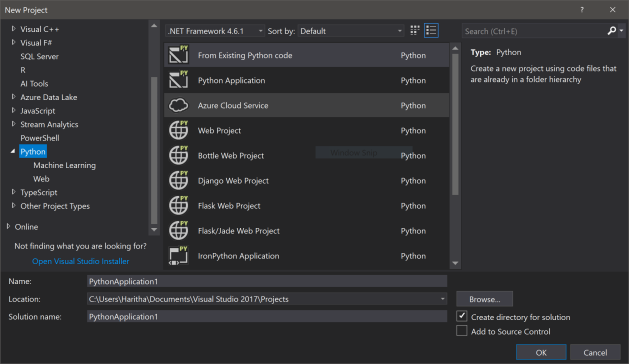 No need to purchase Visual Studio enterprise or ultimate. The freely available Visual Studio Community edition works fine. In 2017 version python comes along side with the default installation options. For the later versions you need to install Python Tools for Visual Studio (PTVS) separately.

 Simple linear regression is a statistical method that allows us to summarize and study relationships between two continuous (quantitative) variables: One variable, denoted x, is regarded as the predictor, explanatory, or independent variable. The other variable, denoted y, is regarded as the response, outcome, or dependent variable.
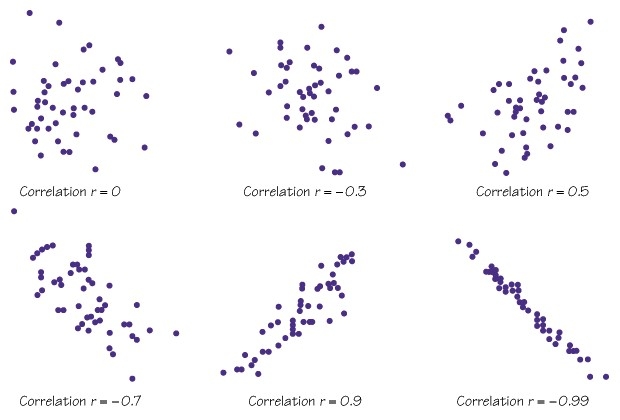 Linear correlation coefficient(also called Pearson product-moment correlation coefficient) measure of the strength and direction of a linear association between two random variables.
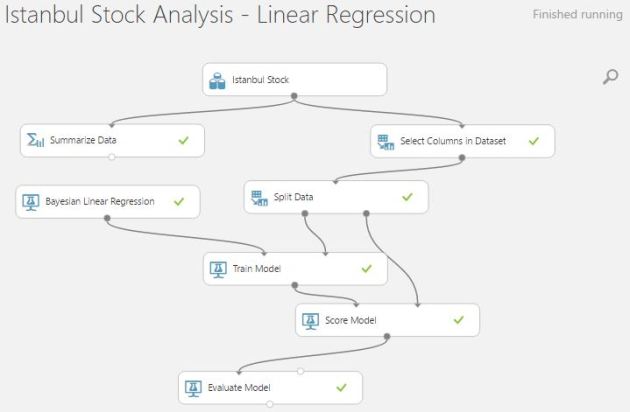 The most interesting part is coming with python! 🙂
 Human Language is one of the most complicated phenomena to interpret for machines. Comparing to artificial languages like programming languages and mathematical notations, natural languages are hard to notate with explicit rules. Natural Language Processing, AKA Computational Linguistics enable computers to derive meaning from human or natural language input.

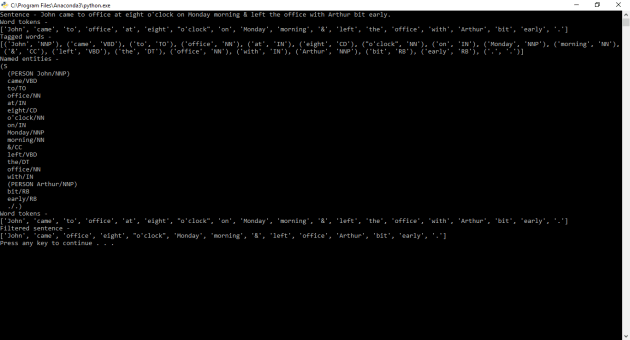 You can Improve these basics to build Named Entity Recognizer and many more…
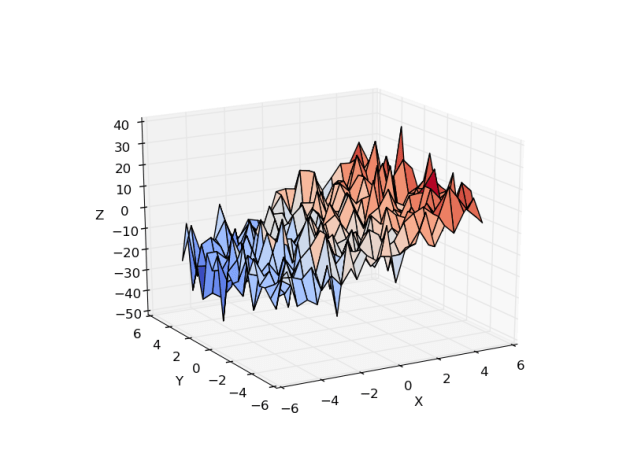 If you are fond of playing with data to dig out the relationships of it and to plot interesting visualizations with data; python is the language you should speak.
 Access your notebook from “Notebooks” tab of AzureML Studio. When creating a new notebook, you can select which language and version you want to have in your notebook. Python 2, Python 3 and R are the supported languages right now.
 On the notebook menu bar, you can find out the ‘help’ menu which contains a brief user interface tour as well as a list of keyboard shortcuts that you can use to drive the notebook.